Fuel costs hit homecare hard
In March 2022, the Homecare Association conducted a survey of its members to assess how the homecare sector was being impacted by increased cost of living, particularly the rapid rise in fuel prices.
Indeed, those receiving lower wages and in less secure employment, such as homecare workers, are most likely to bear the brunt of such sharp increases.
Overall, 627 homecare providers submitted an approved response to the survey, and the results were stark.
Half of respondents asserted that careworkers had requested an increase in the mileage rate, while more than a fifth (21%) added that careworkers had either given notice, intended to look for work elsewhere or had already done so because they cannot afford to put fuel in their cars.
Furthermore, 92% of providers were either concerned or very concerned about the effect of the rise in fuel costs on the financial viability of their company.
Since the time of the survey, the issue has started to gain some political traction.
Labour MP Jessica Morden raised the matter during a Westminster Hall debate on an e-petition that asked for a 40% cut to fuel duty for the next two years.
She also submitted a written question to the Secretary of State to try and discover what assessment had been made of the impact of escalating fuel costs on the sector. Regrettably, no such assessment has been made.
Meanwhile, fuel costs continue to augment to record levels, according to the Government’s own statistics on average weekly UK pump prices (details of the data sources and methodology is also available online).
For the week commencing 23 May 2022, the average cost of (ultra-low sulphur) unleaded petrol was £1.68 per litre, while the corresponding figure for (ultra-low sulphur) diesel was £1.81 per litre.
As demonstrated in the following chart, petrol and diesel prices have, for the most part, steadily increased over the last two years. Indeed, of the 104 weeks after the week commencing 25 May 2020 up to and including 23 May 2022, there were only 13 occasions where the cost of petrol had fallen from the previous week, with the same statistic for diesel.
Consequently, the average UK price per litre for petrol and diesel was 31% and 38% higher respectively than a year ago (week commencing 24 May 2021). Compared with May 2020, the percentage rises were 60% for petrol and 62% for diesel.
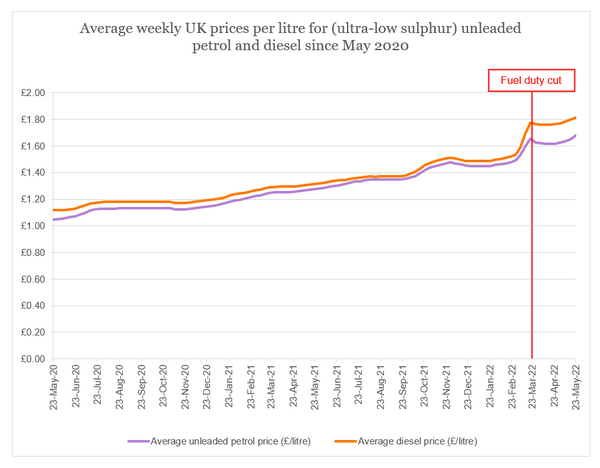
During the timeframe depicted, the rate of VAT for fuel (petrol and diesel) has remained constant at 20%.
However, there has been a recent change in the rate of fuel duty for the first time since March 2011.
In the 2022 Spring Statement, the Chancellor cut the duty by 5p per litre – from 58p per litre to 53p per litre (when rounding) for petrol and diesel.
The data indicates why Rishi Sunak must have felt compelled to act. From around the start of March, average petrol prices rose dramatically by 16p per litre within three weeks, while average diesel costs grew by 24p per litre during this period, as the war in Ukraine had an undoubted impact.
However, the data also indicates two other points:
- As previously documented by the AA, the fuel duty cut was not typically passed on to drivers when filling their vehicles. The average per litre price for petrol fell by only 2.7p the following week, similarly a drop of only 1.0p for diesel.
- Given fuel prices are higher now than before the fuel duty cut, the policy was ineffective.
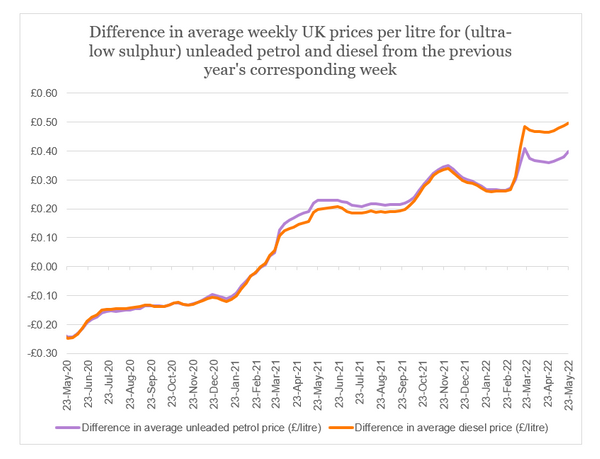
Starting again from May 2020, fuel prices during that year were lower than for each respective week in 2019. But since March 2021, the cost of petrol and diesel has been consistently above what was recorded during the previous year.
On the graph below, the lines for petrol and diesel prices mimic each other regularly. However, that has not been the case since mid-March 2022. In fact, for the week commencing 23 May 2022, the difference from May 2021 in average diesel cost was 50p per litre – the largest such annual growth since data is available. For petrol, the respective statistic was 40p per litre, which was only slightly lower than its record high from March 2022.
Overall cost to homecare
In the UK, an estimated 2.5 billion kilometres (or 1.5 billion miles) are driven in a year for homecare visits – based on a total of around 540 million visits annually (combining state-funded and self-funded care) and an average travel distance of 4.6km per visit.
The Government releases figures on the proportion of licensed cars in the UK by fuel type (see dataset VEH1103), enabling an estimate of the total number of kilometres travelled annually on homecare visits by petrol and diesel cars.
Moreover, the consumer research website, NimbleFins, has computed the average miles per gallon (mpg) for petrol cars in the UK to be 36 mpg, compared with 43 mpg for diesel cars.
After converting these figures to the metric equivalent of litres per 100km and using the approximate number of kilometres driven by fuel type, this means that an estimated 113 million litres are used on homecare visits annually by petrol cars, similarly 60 million by diesel cars.
Based on the average weekly prices for fuel in the respective week in May over the last three years (as discussed above), we can estimate the total annual fuel cost in the UK for homecare visits:
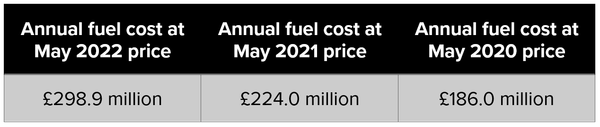
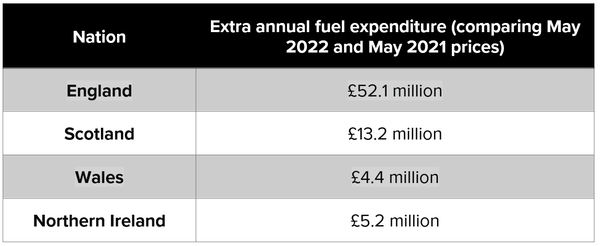
Thus, the UK’s homecare sector is collectively spending around an additional £75 million on fuel (petrol and diesel) compared with a year ago. Using an estimated number of visits, this extra expenditure is split between the four UK nations as follows:
It should be stressed that these calculations are underpinned by a series of assumptions, including:
- The number of annual homecare visits remains constant between different years. In reality, this number will likely increase year on year.
- All visits are undertaken by car (however, our members have provided anecdotal evidence that suggests very few visits are made by public transport).
- The proportion of licensed cars by fuel type is the same for careworkers as for the general UK population.
- The proportion of licensed cars by fuel type reflects the proportion of kilometres travelled for both petrol and diesel cars.
Nevertheless, the figures give a clear indication as to the impact that the escalating fuel costs are having on the homecare sector.
UPDATE: Since the above analysis was conducted, fuel prices have climbed even further - so much so that, for the week commencing 27 June 2022, the average UK price per litre for petrol was 46% higher than a year ago, while diesel was 48% more expensive. This means that an extra £107 million is now being spent by the UK's homecare sector annually on fuel.
Clean Air Zones (CAZs)
In our March 2022 survey, we asked members about the planned, London-wide expansion of the Ultra Low Emission Zone (ULEZ), i.e. to the boundary of the current Low Emission Zone which covers nearly all of Greater London. In response, some providers outside of the capital also referred to ‘Clean Air Zones (CAZs)’ in other parts of England.
As outlined in the Government’s framework document, a CAZ is an area (typically urban) in which targeted action is undertaken so that air quality can be improved. A CAZ can either be non-charging or charging (such that a fee will need to be paid for a vehicle to enter or move within a zone, if that vehicle does not meet the emission requirements for that zone).
There are typically four types of charging CAZ (Classes A to D) that describe which vehicles are subject to the restrictions:
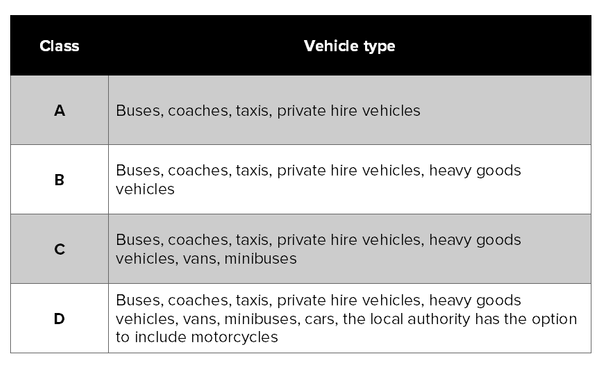
In other words, Class D is the category most applicable to homecare workers, as it is the only one that covers cars. In that scenario, to avoid a charge in a CAZ, the car must meet a minimum emission standard, known as Euro 4 for petrol cars (generally those first registered after 2005) and Euro 6 for diesel cars (generally those first registered after September 2015).
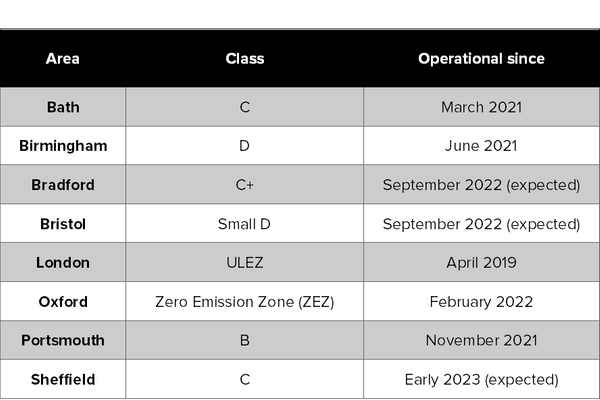
The following table indicates the cities in England in which a CAZ (or variant thereof) is currently operating, or is expected to be introduced:
Notes
• Bradford’s Class C+ CAZ does not include passenger cars and motorbikes.
• Bristol’s CAZ covers a small area of the city, hence the ‘small D’ classification.
• London’s ULEZ operates in a similar way to a Class D CAZ.
• Oxford’s ZEZ covers all petrol and diesel vehicles, including hybrids. At present, a pilot scheme is operating on some roads, but this could cover the rest of the city centre next year.
There have also been developments regarding CAZs in other cities:
• Greater Manchester’s plans for a chargeable CAZ have been dropped, subject to government approval.
• Liverpool is contemplating the possibility of a charging CAZ.
• Newcastle’s proposals for a CAZ have been postponed indefinitely.
(It should also be noted that, in Scotland, Low Emission Zones are being introduced in Aberdeen, Dundee, Edinburgh and Glasgow, covering vehicles that include petrol and diesel cars).
Within England, Birmingham, Bristol, London, and Oxford have, or are expected to have, a CAZ (or variant) that applies to cars. The daily charges for cars in each of these cities are stated in the next table (with the potential for a driver to receive a penalty fine in addition, if the daily charge is not paid within a set time limit).
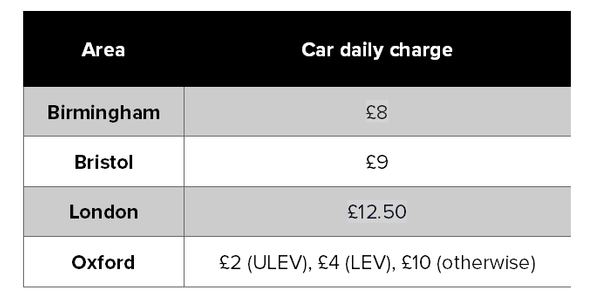
Oxford’s charges vary between ultra-low emission vehicles (ULEVs), low emission vehicles (LEVs) and all other vehicles. From August 2025, the daily charges for these categories are expected to rise to £4, £8 and £20 respectively.
However, there is the possibility that homecare workers could be made exempt from the daily charge. While health and care workers are not listed under the national exemptions for the charge, a local authority could introduce their own exemption.
In Birmingham and London, there is no such exemption for health and care workers (other than ambulance services in Birmingham). Bristol has an exemption for ‘people working within the zone and earning less than £26,000 a year’, but this is only temporary until the end of 2022. It is a different story in Oxford, where health and care workers (including those providing ‘community-based social care services’) are eligible for a 100% discount from the daily ZEZ charge (although an application for a discount must be done in advance).
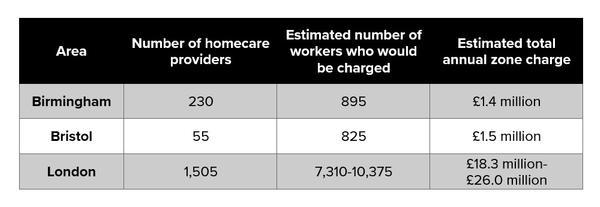
Nevertheless, for the local authorities of Birmingham and (the City of) Bristol, and the London region (if ULEZ is made London-wide), we can estimate the total annual charge to the local homecare sector for entering/moving inside these zones.
Firstly, the Department of Health and Social Care’s (DHSC’s) monthly adult social care statistics for England indicate the number of homecare providers (with the data being such that counts are rounded to the nearest five), as well as the number of homecare staff who deliver care (adjusted by reported response rate) in Birmingham, Bristol and London.
From there, we estimate the number of homecare workers who would be charged, i.e. those owning cars that are not compliant with the minimum emission standards. Regrettably, the Government does not publish data on car ownership by Euro 1-6.
However, current compliance with Birmingham’s CAZ for cars has been found to be 90% at the end of December 2021, while it is thought that more than 71% of vehicles are already compliant with Bristol’s CAZ.
Further, a December 2021 report on the ULEZ discovered that compliance rates for all vehicles inside the zone stood at 92%, while this proportion dropped to 82% for vehicles travelling in outer London (which would become part of the ULEZ under existing plans).
At present, there are ten London boroughs that are wholly outside the ULEZ: Barking and Dagenham, Bexley, Bromley, Croydon, Harrow, Havering, Hillingdon, Kingston upon Thames, Merton and Sutton.
Again, using DHSC figures, we can determine the number of homecare workers for each of these boroughs (adjusted by response rate), add together and so find the proportion working at providers outside the current ULEZ. As a result, figures for the quantity of London homecare workers inside and outside the ULEZ who would be charged under existing compliance rates (if the zone is expanded) can be estimated.
However, the current ULEZ cuts through several other London boroughs, which are therefore only partially covered. Consequently, the above working will produce a minimum estimate when the figures are summed. We can obtain a maximum estimate by repeating for London boroughs that are wholly inside the ULEZ: Camden, Hackney, Hammersmith and Fulham, Haringey, Islington, Kensington and Chelsea, Tower Hamlets and Westminster (excluding the City of London for which data are not available).
From there, using Skills for Care data, the number of workers with non-compliant cars can be split between those working full-time and those employed part-time.
Finally, annual charges for full-time and part-time homecare workers can be computed and summed in each area to give the following table (with the London figures being a range between minimum and maximum estimates).
Once again, these calculations are driven by a variety of assumptions:
- All visits are undertaken by car.
- The compliance rates remain constant during the year (in reality, these will improve).
- Compliance rates of cars with minimum emission standards for homecare workers is the same as the overall local population.
- Each full-time homecare worker is employed five days a week; each part-time worker is employed 2.5 days (i.e. three chargeable days) a week.
- Homecare workers in Birmingham could claim a temporary exemption (valid until 31 May 2023) if they are a resident of the zone. This is also true for residents in Bristol's CAZ (available until the end of 2022). Unfortunately, we have no way of knowing how many homecare workers live within each zone (and so could be exempt), so Birmingham and Bristol's figures should be treated as maximum estimates. Note that London's 100% discount for residents of the ULEZ has ended.
- DHSC data is based on the location of providers, not staff. We cannot account for homecare workers who travel from outside the current ULEZ to inside. It is also assumed that the expanded ULEZ and Greater London are coterminous.
Conclusion
The Homecare Association has previously highlighted the significant disparity in mileage rates received by NHS staff and homecare workers, with the former often being paid 54p per mile but the latter sometimes only 10p per mile.
This is coupled with homecare workers not being able to purchase more fuel-efficient vehicles, which is especially problematic in cities where a Clean Air Zone (or variant thereof) is in operation.
With providers seriously concerned about their future viability and careworkers leaving their roles, it is incumbent on the Government to step in and provide support.
Therefore, we reiterate our call for the Government to provide temporary grant funding as a fuel allowance to cover increased costs of fuel for vehicles needed to deliver homecare. As we have seen, the UK homecare sector requires an extra £75 million to cover the dramatic rise in fuel costs since May 2021.
Regarding charges in Clean Air Zones and similar initiatives, help is available from central government – for example, grants to discount the cost of buying a new low-emission vehicle or the installation of charge points for electric vehicles. Moreover, there are examples of vehicle scrappage schemes in Birmingham, Bristol and London (which is now closed to new applications).
However, for homecare workers already struggling with the inflated cost of living, purchasing a compliant vehicle, even with a discount, may not be a realistic option.
In the zones where cars could be liable for a charge, there is a lack of consistency regarding an exemption/discount for homecare workers. It seems strange that local authorities have been left to their own devices in making such decisions.
Consequently, we also call on the Government to add health and care workers to the national list of exemptions, so clearing up the confusion once and for all.